Know what you made. And what you didn't.
Mach 1 gives ops and finance teams real-time visibility into margin, fill rates, and revenue leakage across every site. So you walk into every meeting knowing not just what you made, but what you didn't make and why.
How do staffing teams see revenue leakage in Mach 1?
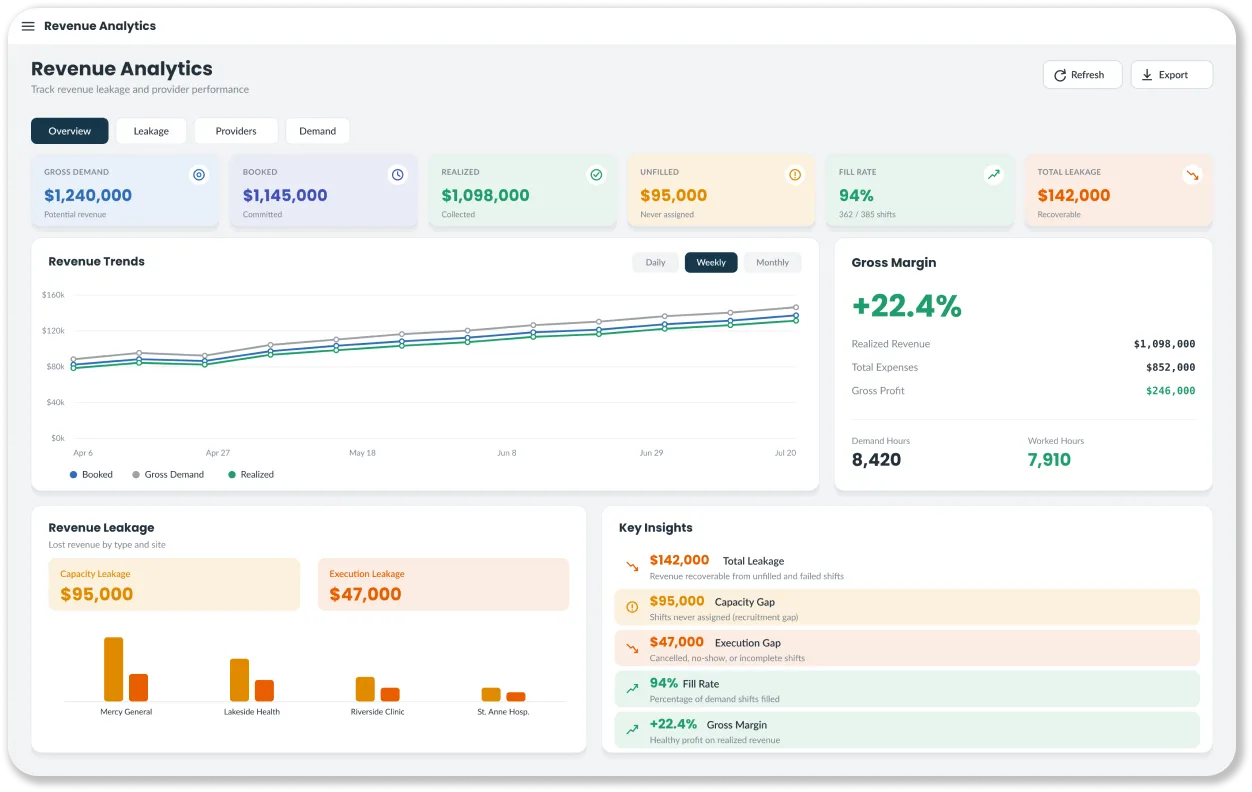
Analytics & Revenue Intelligence follows revenue through three stages: gross demand, booked, and realized. The drop from demand to booked is capacity leakage, shifts you never filled. The drop from booked to realized is execution leakage, shifts lost to cancellations and no-shows. Both are broken down by site, job, and worker, alongside fill rate and time to fill.
- 01Scheduling & Shift ManagementFill every shift without the coordination chaos.
- 02Workforce & ComplianceLive credential enforcement at every action.
- 03Time, Rates & BillingEvery hour captured. One clean billing artifact.
- 04Analytics & Revenue IntelligenceReal-time margin, fill rate, and leakage.
- 05SyncPaper timesheets in. Clean data out.
The numbers you see the moment you log in.
Figures shown are illustrative.
Most platforms tell you what got filled. This tells you what didn't, and what it cost.
Revenue loss split into two named categories, with dollar figures attached. This is the number that walks into the board meeting.
Shifts you had demand for but never assigned a worker to.
Shifts assigned but not completed cleanly.
Real-time visibility, not historical reporting.
Every number is current and forward-looking. The forecast is rule-based and deterministic, never a black box.
Book a Demo- 01Gross Margin Visibility per shift, per site, per client, after pay, OT, and reimbursements
- 02Fill Rate Tracking with 7/30/90-day trends, linked to the Leakage Diagnostic
- 03Forecast Bill and Pay, rule-based and deterministic, exportable to your system of record
- 04Per-Site Breakdowns across margin, fill rate, leakage, and compliance
Every capability connects to the next.
Analytics & Revenue Intelligence: common questions.
What is revenue leakage in staffing?
Revenue leakage is demand you had but never billed. Mach 1 separates it into capacity leakage, shifts you never assigned a worker to, and execution leakage, shifts that were booked but not completed cleanly because of cancellations, no-shows, or early departures.
Is the demand forecast a black box?
No. The forecast is a 26-week projection built with linear regression on your own demand history, shown with a confidence band. You can see what it is based on, and it is not an opaque model.
Can I compare performance across sites?
Yes. Demand, booked and realized revenue, and both kinds of leakage break down by site, job, and worker. Fill rate and time to fill are tracked alongside them, and the data exports to CSV.